Chapter 1
The short answer: product truth comes before layout
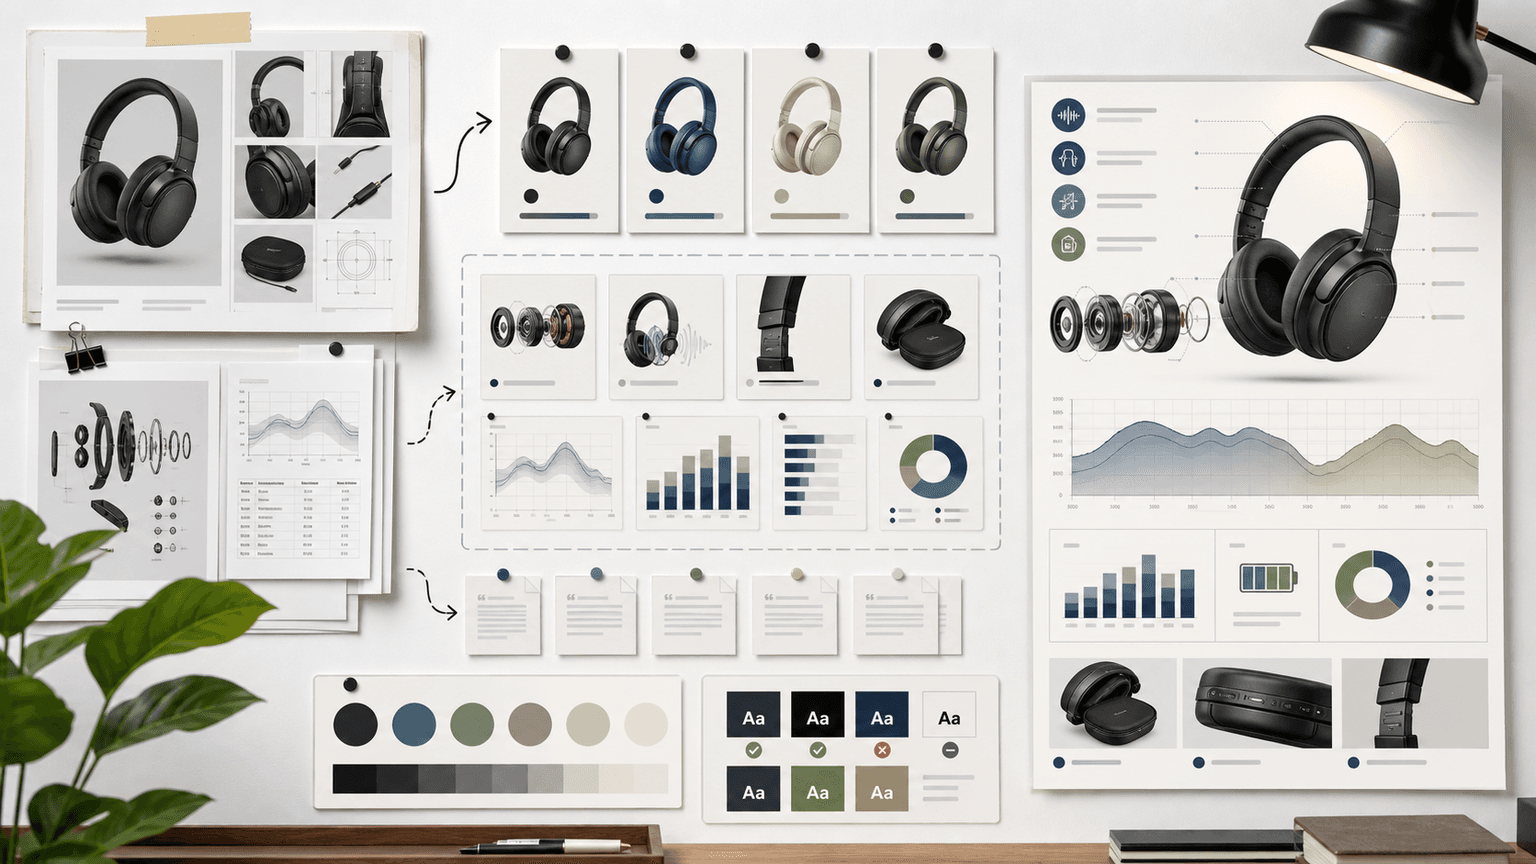
An AI-generated product infographic checklist should verify product accuracy, variant accuracy, source-backed claims, chart integrity, mobile readability, accessibility, citation placement, and destination-page match. Use AI for layout exploration, but keep final numbers, labels, product details, and claims under human control.
Product infographics are persuasive because they look organized. That makes unsupported or wrong claims more damaging. A comparison table that invents a feature, a chart that exaggerates a benefit, or a variant guide that mixes SKUs can create real buyer confusion.
Start from the product page, product media, variant data, and claim sheet. Only then should the team generate or design the infographic.
Check the exact SKU, variant, bundle, or plan.
Use real product documentation and source notes.
Do not let AI invent chart values or feature comparisons.
Add final text and labels in a controlled design step.
Link to the matching product, collection, or guide.
Chapter 2
Name the product decision the infographic supports
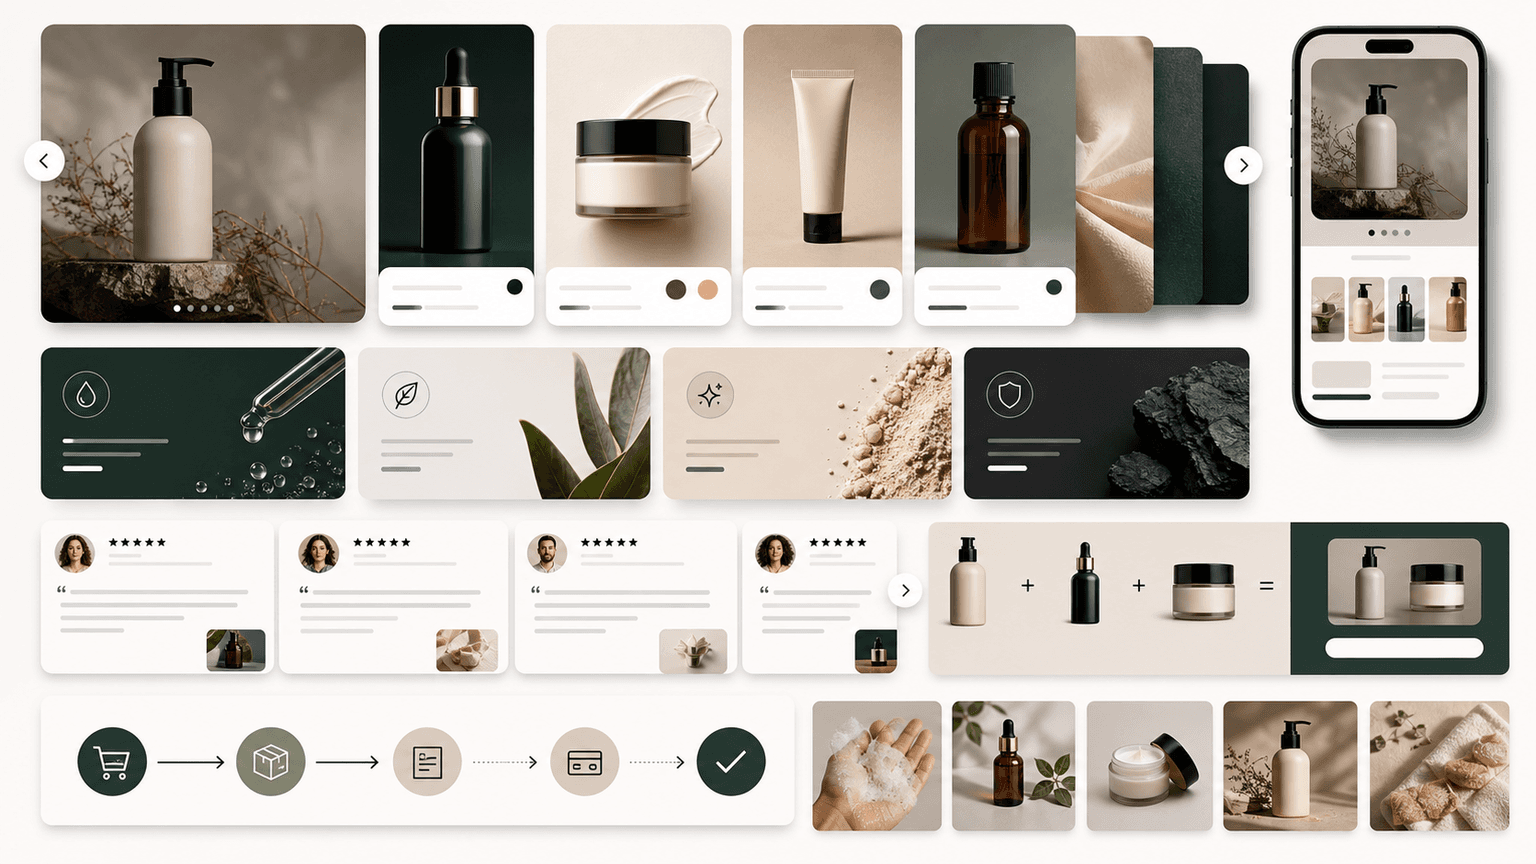
A product infographic should help a buyer make one decision. Which variant should I choose? What is included in the bundle? How does the product work? How does this routine fit together? What is the difference between plans? What result is realistic?
The decision determines the format. A variant guide needs a comparison matrix. A routine needs a sequence. A bundle needs a component map. A product mechanism needs an annotated diagram. A launch offer needs an inclusion and deadline summary.
If the infographic cannot be tied to a buyer decision, it is probably decoration. Decorative product graphics can be useful, but they should not pretend to be evidence.
- 1
Choose one decision
Variant choice, bundle understanding, routine education, feature comparison, launch offer, or objection handling.
- 2
Choose one format
Matrix, flow, timeline, annotated image, checklist, ingredient map, or bundle map.
- 3
Choose one destination
The exact product, collection, guide, comparison page, or bundle page the infographic should support.
Chapter 3
Verify product and variant truth
Product and variant truth should be checked before any layout is approved. Shopify product media and variant image documentation highlight a simple ecommerce reality: shoppers rely on visual and variant-specific information to understand what they are buying.
For AI-generated infographics, this means the chart, diagram, or comparison should not blend multiple variants unless the post explicitly explains the relationship. If a bundle has three products, show those exact three products. If a plan lacks a feature, do not place it in the wrong column.
Create a product truth table with SKU, variant, image reference, included features, excluded features, and destination URL. The infographic is allowed to visualize only what the table supports.
SKU, variant, bundle, or plan is correctly named.
Images match the correct product and variant.
Included features are real.
Excluded features are not implied.
Destination page matches the visual asset.
Build from this playbook
Turn product truth into reusable social infographics
AttentionClaw helps ecommerce teams transform product details and source-backed claims into carousels, slideshows, and campaign visuals.
Chapter 4
Use a claim sheet for every number and comparison
Every statistic, ranking, timeline, comparison, and feature claim should trace to a source. The source can be product documentation, owned analytics, official platform documentation, or credible research. It should not be an AI-generated guess.
Google's structured data documentation is useful as a principle: structure helps when the underlying information is accurate. Infographic structure works the same way. A polished layout cannot fix unsupported information.
The claim sheet should include approved wording, source URL, date accessed, and forbidden stronger wording. This prevents an infographic from turning a qualified claim into an absolute promise.
- 1
Approved claim
The exact statement the infographic can make.
- 2
Source
The product doc, analytics source, official documentation, standard, or research URL that supports it.
- 3
Visual treatment
Whether the claim should appear as text, chart, table, icon, flow, or callout.
- 4
Forbidden wording
Any stronger version that would overstate the evidence.
Chapter 5
Generate layout options, then rebuild final text
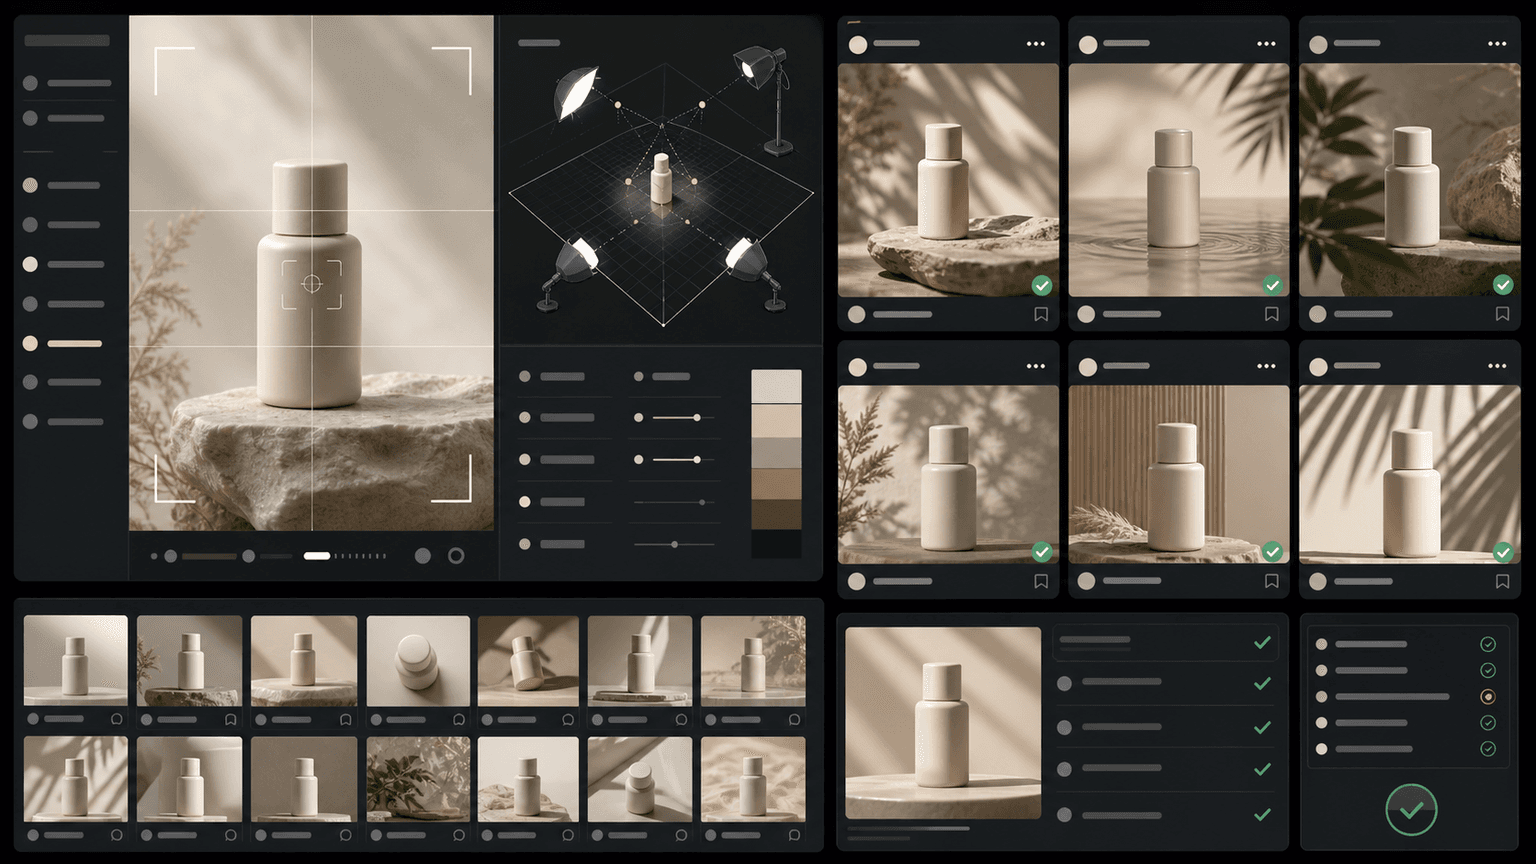
AI is useful for exploring layout directions: composition, hierarchy, icon treatment, scene style, and slide rhythm. It is not reliable enough for final factual text, tiny labels, product specifications, or chart values without human review.
Generate several layout options from the claim sheet, choose the clearest one, then rebuild final copy in a controlled design layer. This is especially important for product labels, pricing, ingredients, dimensions, legal disclaimers, and plan comparisons.
If the infographic is a social carousel, break it into one idea per slide. Do not compress an entire product page into one square image.
Use AI for visual direction and hierarchy.
Use product docs for final wording.
Use real data for charts.
Use design layers for final text.
Use one product decision per infographic.
Chapter 6
Check accessibility and mobile readability
Product infographics often fail because the team tries to fit too much information into one image. On social platforms, most users see the asset on a phone. If the text, chart labels, or product details are unreadable, the infographic does not help.
W3C contrast guidance gives teams a concrete minimum for text contrast. Social assets should also use short labels, clear reading order, enough spacing, and caption support for complex visuals.
If the infographic cannot be read at phone size, split it into a carousel or link to a longer guide. More slides are better than one crowded graphic.
Readable headline and labels at phone size.
Strong foreground-background contrast.
No tiny generated microtext.
No color-only encoding for important distinctions.
Caption or alt text explains complex information.
Chapter 7
Reuse the infographic as a campaign system
A strong product infographic can become multiple assets: product-page support graphic, Instagram carousel, TikTok slideshow, LinkedIn document, email image, and blog illustration. The key is to keep the same claim sheet attached to every reuse.
Meta, TikTok, and LinkedIn carousel formats all impose different constraints. Adapt the crop, density, first card, and CTA for each platform instead of reposting one crowded image everywhere.
AttentionClaw can help teams turn verified product education into repeatable social assets, but the source-backed product truth should remain the center of the workflow.
Product page: clearer detail and more context.
Instagram carousel: one idea per slide.
TikTok slideshow: vertical, faster, stronger first frame.
LinkedIn document: decision-oriented and source-aware.
Blog graphic: deeper explanation with citations.
Callout
Turn product truth into reusable social assets
Use AttentionClaw to turn product truth and source-backed claims into reusable social infographics, carousels, and slideshow campaigns.
Chapter 8
A two-pass review workflow before publishing an AI-generated infographic
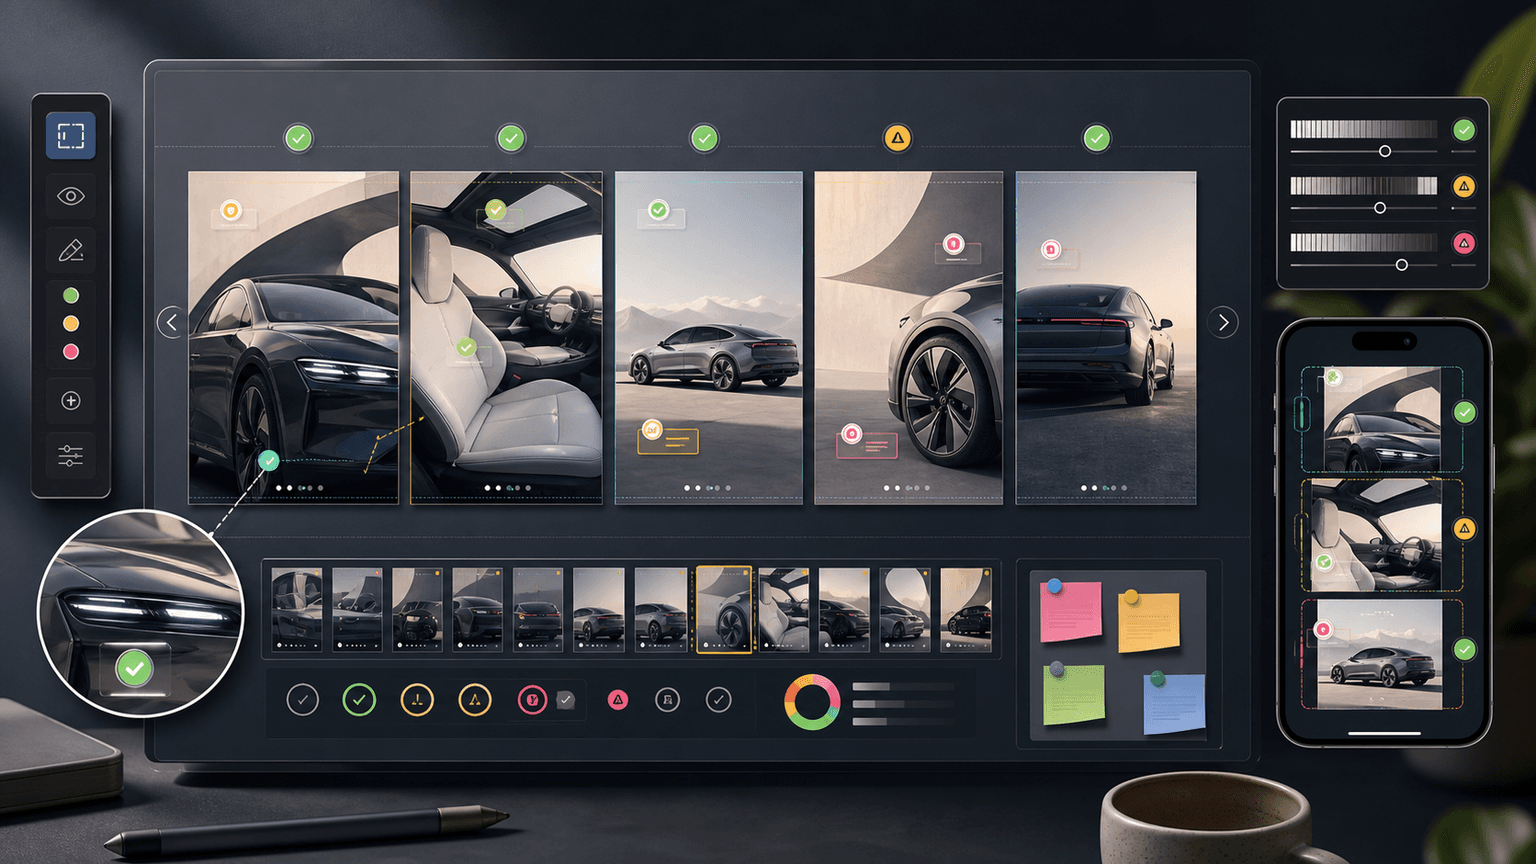
A single review before publishing is usually not enough for an AI-generated product infographic, because different types of errors require different modes of attention. A two-pass workflow — one pass for factual accuracy and one pass for visual and presentation accuracy — catches both the claim-level errors and the display-level errors that are easy to miss when reviewing everything at once.
The first pass is done by someone with product knowledge: the person responsible for the SKU, the product manager, or the brand owner. They verify every claim, number, and label against the product source of truth. The second pass is done with fresh eyes on the rendered image — checking whether text is legible at small sizes, whether icons match their labels, and whether the layout reads in the intended order on a phone screen.
- 1
Pass one: factual review
Check every product claim, specification, comparison, and call-out against the documented product source — spec sheet, packaging copy, or approved marketing brief. Mark any item that cannot be verified for removal or revision.
- 2
Pass two: visual and readability review
View the final image at actual display size on a phone screen. Check that all text is legible, all icons are recognizable, the reading order is obvious, and no element looks unfinished or misaligned.
Callout
Do the mobile check last, not first
AI-generated infographics are usually reviewed on a desktop screen, where everything looks fine. The mobile check should be the final gate before publishing, because that is where the audience will actually see it. Thumbnail-sized text and small icons that looked acceptable at desktop resolution often fail at phone scale.
Next step
Turn this guide into a production-ready carousel.
AttentionClaw helps ecommerce teams transform product details and source-backed claims into carousels, slideshows, and campaign visuals.
Keep the workflow inside AttentionClaw.
Common Questions
FAQ
More Reading
Keep reading
8-chapter read
AI Product Image Variant Control for Ecommerce Campaigns
AI product variant control means locking which details can change and which cannot: color, size, label, material, scent, flavor, bundle contents, and product-page destination. Without variant rules, AI-generated social content can accidentally sell a product that does not exist.
8-chapter read
Consistent AI Typography for Social Images
Consistent AI typography comes from separating generated layout exploration from final text production. Define type roles, hierarchy, contrast, density, safe zones, and QA rules before approving social images.
Visual QA Checklist for AI-Generated Carousels
AI-generated carousels need a QA pass that checks continuity, readability, factual claims, product or character accuracy, source support, accessibility, and CTA match before publishing.
9-chapter read
Generated Infographic Workflow for Social Media Teams
Generated infographics need a source-first workflow. Start with the claim and evidence, then design the visual explanation, generate layout options, add final text manually, check accessibility, cite sources, and reuse the strongest frames as carousels or slideshows.
9-chapter read
Source Citation Checklist for AI-Assisted Social Content
AI-assisted social content needs a source checklist whenever it makes factual, product, performance, legal, health, financial, environmental, platform, or customer-proof claims. The checklist should define claim risk, acceptable sources, citation notes, reviewer status, and rewrite rules before content is scheduled.
8-chapter read
Brand Safety Checklist for AI-Generated Social Images
AI-generated social images should not go live because they look polished. They need a brand-safety review that checks product fidelity, claim accuracy, platform policy, accessibility, disclosure, and landing-page match before publication.
E-Commerce Carousel Templates That Actually Drive Sales (Not Just Likes)
Most e-commerce carousel templates are designed for engagement, not revenue. The formats that actually drive sales look fundamentally different from the ones that rack up likes, and understanding that distinction is worth thousands in monthly revenue.
How to Keep Product Photos Consistent Across AI-Generated Social Posts
Consistent AI product images come from a system, not a lucky prompt. Lock the product reference, camera rules, lighting, background family, brand palette, allowed variations, and review checklist before generating campaign assets. Then vary context and message without changing the product identity.
Sources
- Product media — Shopify Help Center
- Adding images to product variants — Shopify Help Center
- Intro to How Structured Data Markup Works — Google Search Central
- Understanding Success Criterion 1.4.3: Contrast (Minimum) — W3C Web Accessibility Initiative
Written by
AttentionClaw
Editorial Team
Editorial context
Part of the Content Planning topic cluster. Last updated June 22, 2026.