Chapter 1
The carousel-to-download pipeline: A measurable framework
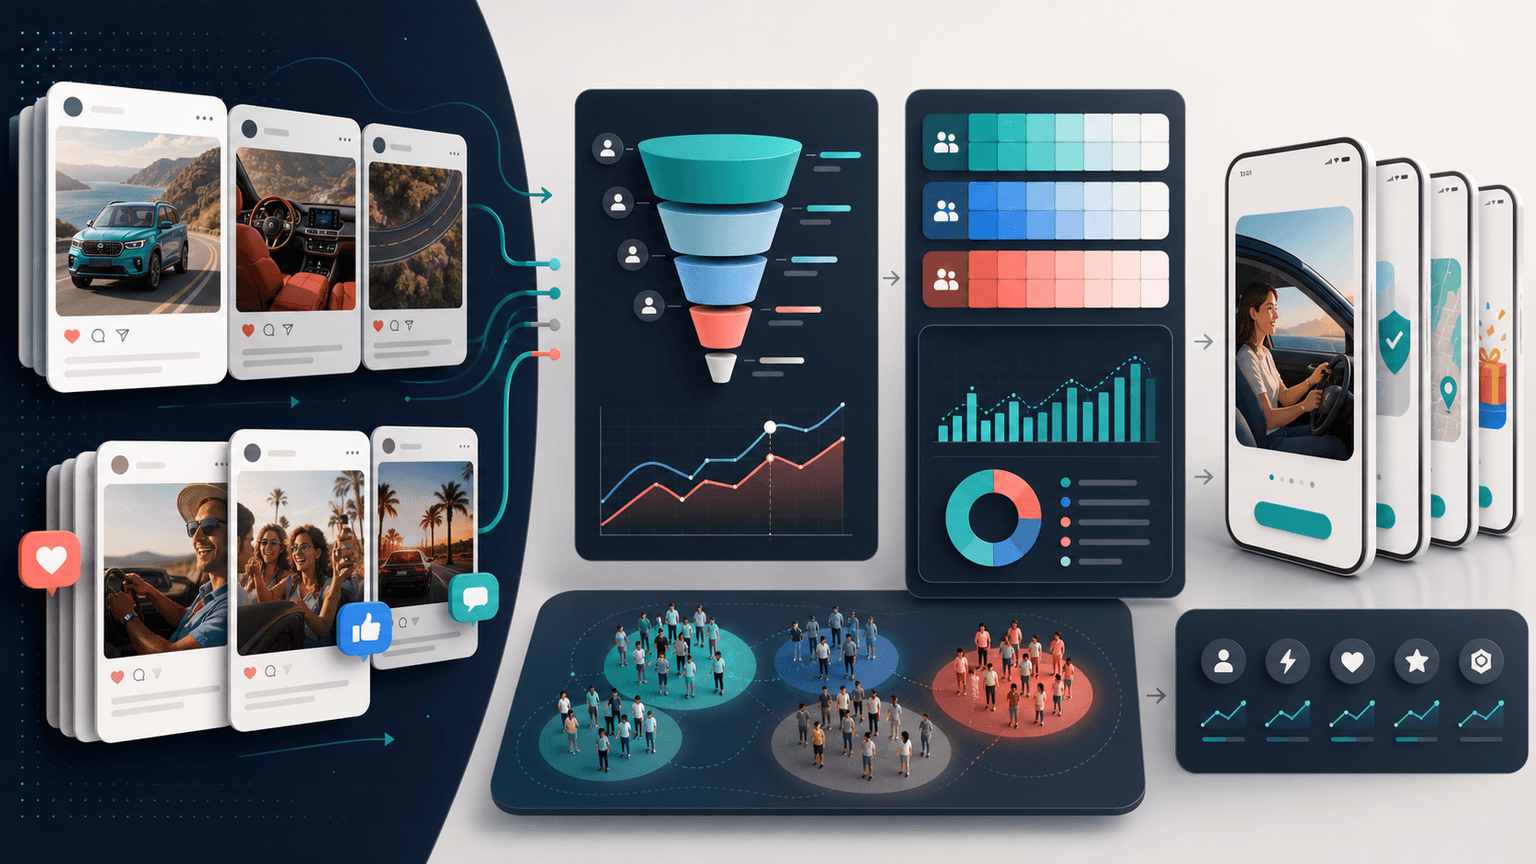
Treating Instagram carousels as a user acquisition channel requires the same rigor you would apply to a paid campaign. You need a clear pipeline with measurable stages, conversion rates between each stage, and the ability to attribute downloads back to specific pieces of content.
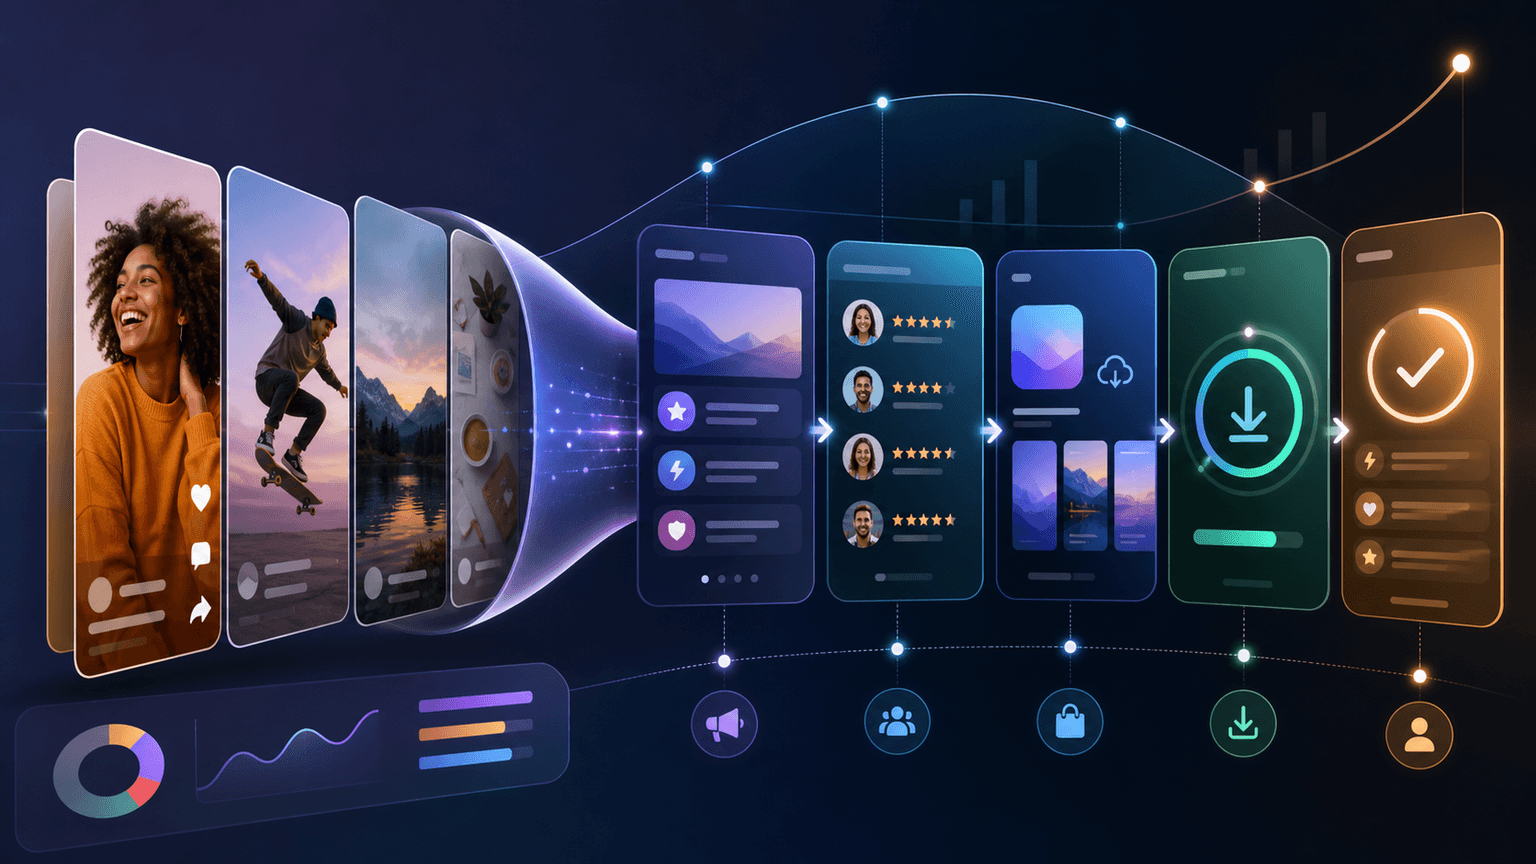
The pipeline has five stages: impression (someone sees your carousel), engagement (they save, share, or swipe to the end), profile visit (they click through to your profile), link click (they tap your bio link), and install (they download your app from the store). Each stage has a measurable conversion rate, and improving any single rate improves your total acquisition output.
When you can see this pipeline clearly, you stop guessing about what content works and start making data-driven decisions. A carousel with 50,000 impressions but zero link clicks is not a success — it is a broken funnel. A carousel with 2,000 impressions and 15 link clicks is potentially your best performer. The metrics reframe your entire content strategy.
- 1
Stage 1: Impression
The number of unique users who see your carousel. Influenced by hooks, hashtags, posting time, and algorithmic distribution. Baseline benchmark: 2,000-10,000 for accounts under 5,000 followers.
- 2
Stage 2: Engagement
Saves, shares, comments, and carousel completion (reaching the last slide). Saves are the strongest signal because they indicate intent to return. Benchmark: 3-8% engagement rate on impressions.
- 3
Stage 3: Profile visit
The viewer clicks through to your profile from the carousel. This is the transition from content consumer to potential customer. Benchmark: 1-3% of engaged users visit the profile.
- 4
Stage 4: Link click
The visitor taps your bio link. This requires a strong bio, clear CTA, and aligned expectations. Benchmark: 10-25% of profile visitors click the link.
- 5
Stage 5: Install
The visitor downloads your app from the store. Influenced by your App Store listing quality and how well it matches expectations set by the carousel. Benchmark: 30-50% of social-referred App Store visitors install.
Chapter 2
Setting up proper attribution tracking
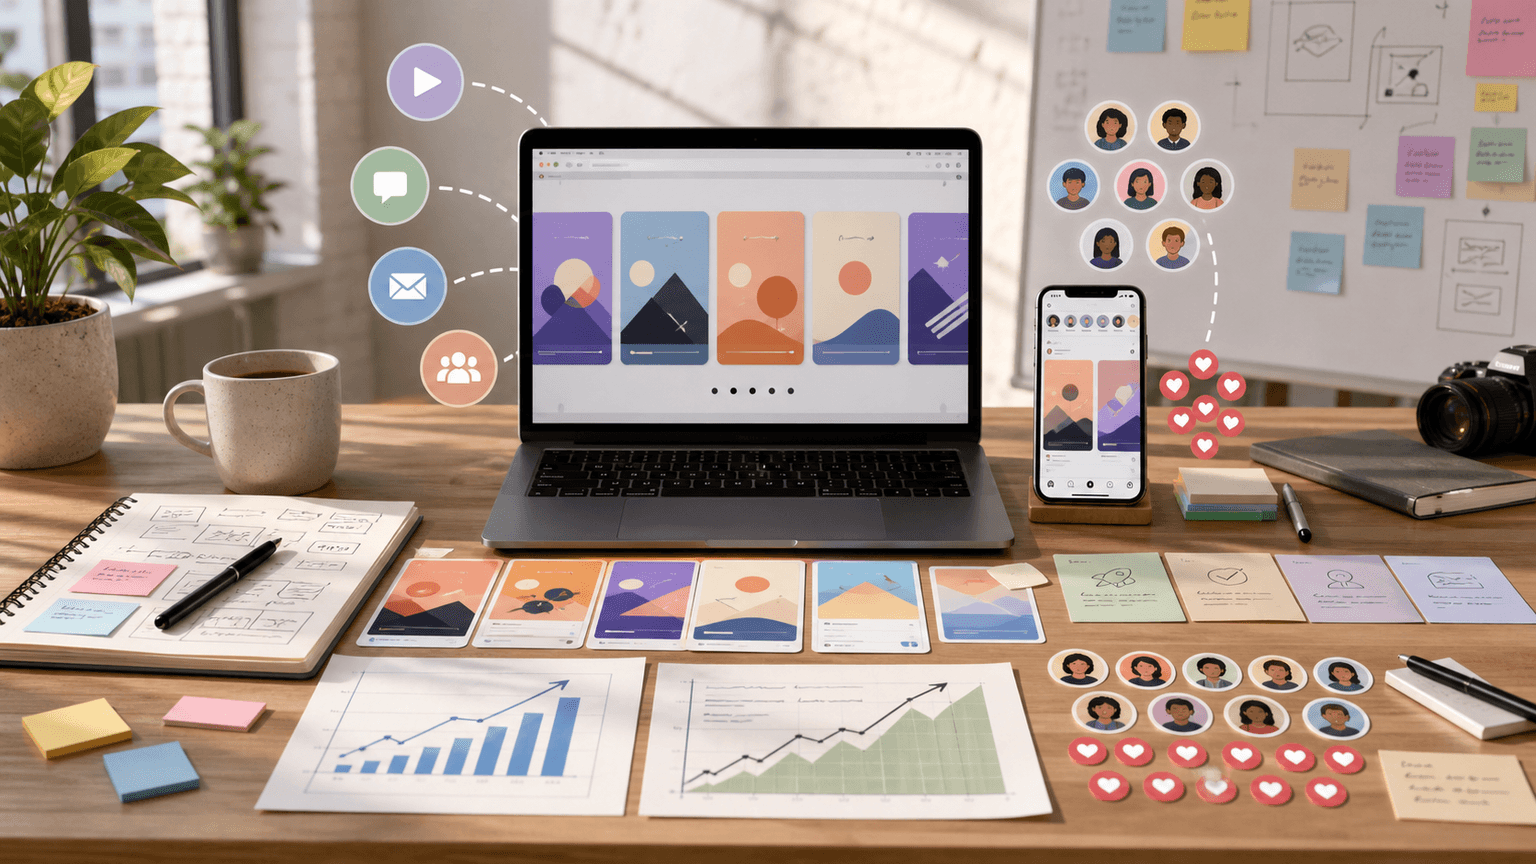
You cannot optimize what you cannot measure. Setting up end-to-end tracking takes 30 minutes and changes everything about how you evaluate content performance.
The fundamental challenge in carousel attribution is connecting Instagram engagement data to App Store download data. These live in separate systems that do not talk to each other natively. The bridge is UTM-tagged links and a link-in-bio tool that tracks clicks by source.
Start by creating a UTM-tagged URL for your App Store listing. Use a link shortener or link-in-bio tool that tracks click timestamps and referral data. Set your Instagram bio link to this tagged URL. Now every click from your profile to the App Store is tracked and timestamped.
On the App Store side, use App Store Connect or Google Play Console to track downloads by referral source. While this data is not perfectly granular, you can correlate daily download spikes with your content publishing schedule and UTM click data to build a clear picture of which carousels drive installs.
- 1
Create UTM-tagged App Store links
Use Google's Campaign URL Builder or a similar tool. Set source as 'instagram,' medium as 'social,' and campaign as a descriptor like 'bio-link.' This lets you segment social traffic in your analytics.
- 2
Set up a tracking link-in-bio
Use a link-in-bio tool that provides click analytics with timestamps. This allows you to correlate specific posting times with click spikes, connecting individual carousels to link click activity.
- 3
Configure App Store referral tracking
In App Store Connect, monitor the 'App Store Browse' and 'Web Referral' channels. In Google Play Console, check the 'Acquisition' reports. Cross-reference with your UTM data to identify social-driven installs.
- 4
Build a correlation spreadsheet
Create a sheet that logs each carousel's publish date, impressions, saves, profile visits, and link clicks alongside your daily download data. Over 2-3 weeks, patterns emerge showing which carousel types drive the most attributed downloads.
Chapter 3
The 6 metrics that matter for carousel-driven acquisition
Instagram provides dozens of metrics, but only six directly correlate with app downloads. Tracking everything creates noise. Tracking these six gives you signal.
- 1
Saves per carousel
Saves are the strongest content quality signal. Users who save a carousel plan to revisit it, which means the content is valuable enough to act on. High-save carousels build the audience that eventually converts. Benchmark: 50-200 saves per carousel for accounts with 2,000-5,000 followers.
- 2
Profile visits per carousel
This metric measures how effectively your carousel drives curiosity about your app. A carousel with high saves but low profile visits usually has a weak CTA or the connection to your app is unclear. Benchmark: 20-100 profile visits per carousel.
- 3
Link clicks per week
Total bio link clicks aggregated weekly. This is your closest proxy for App Store traffic from social. Track it weekly rather than per-post because link clicks are influenced by cumulative content, not just the most recent carousel.
- 4
Carousel completion rate
The percentage of first-slide viewers who reach the last slide. This tells you whether your content structure holds attention. Low completion means your middle slides are losing people. Benchmark: 40-60% completion rate for 8-10 slide carousels.
- 5
Cost per carousel
Even with zero ad spend, your carousels have a cost: your time. Track how many minutes each carousel takes to produce, multiply by your hourly value, and divide by the downloads it generates. This gives you an effective cost per install to compare against paid channels.
- 6
Downloads attributed to social
Using your UTM tracking and App Store referral data, estimate the number of weekly downloads driven by your Instagram carousels. This is the ultimate metric — the one that determines whether carousel marketing is worth your time.
Build from this playbook
Scale your carousel acquisition with AI production
AttentionClaw generates brand-consistent Instagram carousels and TikTok slideshows in minutes. Spend less time on design and more time optimizing the metrics that drive downloads.
Chapter 4
Optimizing conversion rates at each pipeline stage
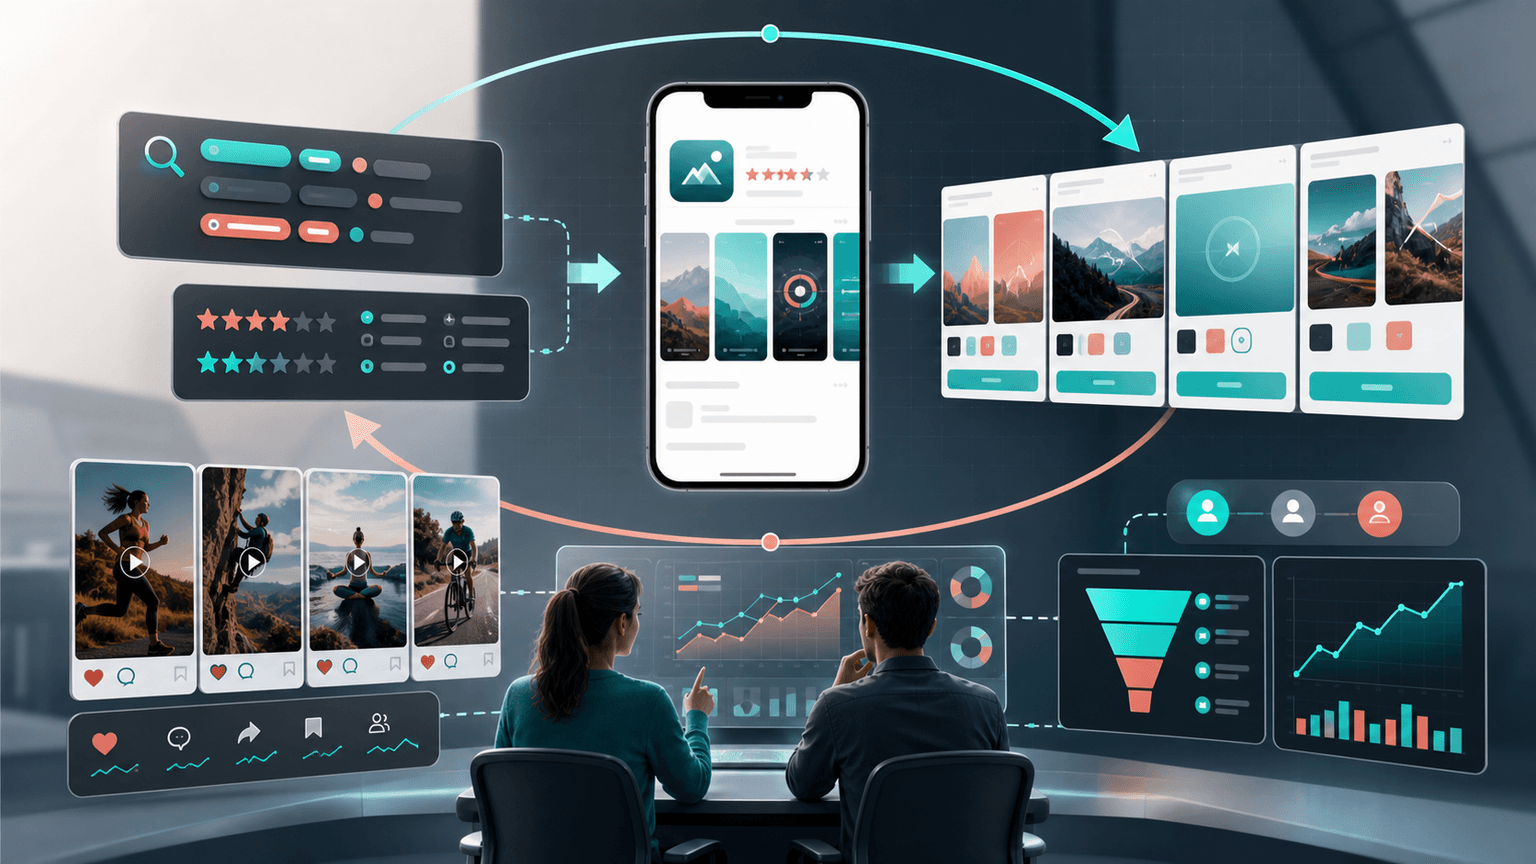
The power of a pipeline framework is that you can identify exactly where downloads are being lost and focus your optimization effort there. Improving the weakest stage produces the biggest gains with the least effort.
If your impressions are high but saves are low, your content is reaching people but not delivering enough value. Focus on content quality — deeper insights, more actionable advice, better-structured slide narratives. If saves are high but profile visits are low, your CTA game is weak — your final slide needs a stronger push toward the profile.
If profile visits are high but link clicks are low, your profile is not converting. Rewrite your bio, improve your pinned posts, and make your link more prominent. If link clicks are high but downloads are low, the disconnect is between your carousel messaging and your App Store listing. Align the language, screenshots, and value proposition across both touchpoints.
- 1
Low impressions: Fix your distribution
Improve hooks to stop the scroll, optimize hashtag strategy for your niche, post during your audience's active hours, and increase posting frequency. The algorithm needs strong initial engagement signals to distribute widely.
- 2
Low saves: Fix your content value
Make every carousel genuinely useful, not just interesting. Include actionable steps, specific numbers, and information people will want to reference later. Saves happen when people think 'I need to come back to this.'
- 3
Low profile visits: Fix your CTA
Your final slide needs to create a clear reason to visit your profile. Try specific CTAs like 'We built an app that does this automatically — link in bio' instead of generic 'Follow for more' closings.
- 4
Low link clicks: Fix your profile
Rewrite your bio for immediate clarity. Pin your three most compelling carousels. Remove any link friction — your bio link should go directly to your App Store listing, not a generic website homepage.
- 5
Low downloads: Fix your App Store listing
Align your App Store screenshots and description with the language and promises in your carousels. Users who arrive from social need to see a seamless continuation of the value proposition, not a generic listing.
Chapter 5
Running content experiments to improve download rates
The fastest way to improve your carousel acquisition pipeline is structured experimentation. Instead of guessing what works, run controlled tests that isolate single variables and measure their impact on downloads.
Each week, change one variable across your carousels while keeping everything else constant. One week, test different hook formats. The next, test different CTA styles. The third week, test different carousel lengths. By changing only one element at a time, you can clearly attribute performance changes to specific variables.
Track each experiment in a dedicated spreadsheet. Log the variable you changed, the variants you tested, and the pipeline metrics for each variant. After 4-6 weeks, you will have a clear playbook of what works for your specific audience — not generic advice, but data-driven insights unique to your app.
- 1
Week 1 experiment: Hook formats
Test three hook styles across your carousels: question hooks, statement hooks, and number hooks. Keep everything else identical. Measure which hook style produces the highest save rate and profile visit rate.
- 2
Week 2 experiment: CTA styles
Test urgency CTAs ('Download before this feature goes paid'), benefit CTAs ('Start saving time — link in bio'), and social proof CTAs ('Join 5K users — link in bio'). Measure profile visits and link clicks per carousel.
- 3
Week 3 experiment: Carousel length
Publish carousels at three different lengths: 6 slides, 8 slides, and 10 slides. Keep hook and CTA identical. Measure completion rate, saves, and profile visits to find your audience's optimal length.
- 4
Week 4 experiment: Content pillar
Increase the share of whichever content pillar drove the most link clicks in weeks 1-3. Reduce the weakest pillar. Measure whether the rebalanced mix improves overall weekly link clicks.
Chapter 6
Conversion benchmarks for carousel-driven app acquisition
Benchmarks give you a baseline for evaluating whether your pipeline is performing well or needs optimization. These numbers come from aggregating data across app developer accounts ranging from 1,000 to 50,000 followers.
Keep in mind that benchmarks vary significantly by niche. A productivity app targeting professionals will have lower impressions but higher conversion rates than a casual game targeting teens. Use these as starting points and build your own benchmarks over 30 days of tracking.
Impressions to engagement (saves + shares): 3-8% — below 3% means your content needs to deliver more value
Engagement to profile visit: 5-15% — below 5% means your CTA or brand connection is weak
Profile visit to link click: 10-25% — below 10% means your profile is not optimized for conversion
Link click to install: 30-50% — below 30% means your App Store listing is misaligned with carousel messaging
End-to-end conversion (impression to install): 0.01-0.1% — this translates to 1-10 installs per 10,000 impressions
Effective cost per install: well below typical paid channel rates when measured against your time investment
Callout
The compounding advantage
Unlike paid acquisition where cost per install stays flat or increases over time, organic carousel acquisition gets cheaper with every month. Your oldest carousels still drive traffic, your production speed increases, and your conversion rates improve through optimization. By month six, your effective cost per install can fall well below early-month levels as production speeds up and older content keeps converting.
Chapter 7
Scaling carousel acquisition from 100 to 1,000+ monthly installs
Scaling organic carousel acquisition requires pulling three levers simultaneously: increasing content volume, improving conversion rates, and expanding to additional platforms. Each lever multiplies the output of the others.
The first scaling lever is volume. Move from 4-5 carousels per week to 7-8 by adding more top-of-funnel content. Awareness carousels have the widest reach ceiling and the longest shelf life, so increasing volume at the top of the funnel feeds the entire pipeline with more potential downloaders.
The second lever is conversion rate optimization, covered in previous sections. The third lever is platform expansion. Every carousel you create for Instagram can be adapted into a TikTok slideshow, LinkedIn document post, or Twitter thread. Cross-posting the same content in platform-native formats can double or triple your total reach without doubling production time.
- 1
Increase content volume strategically
Add 2-3 top-of-funnel carousels per week. These feed the pipeline with new potential users. Use batch production to keep the time investment manageable — 7 carousels should take the same session as 5 with a refined system.
- 2
Optimize your weakest conversion stage
Identify the pipeline stage with the biggest drop-off and focus all optimization effort there. A 50% improvement in your weakest stage is worth more than a 10% improvement across all stages.
- 3
Expand to TikTok slideshows
Adapt your best-performing Instagram carousels into TikTok slideshows with trending audio. TikTok's organic reach is significantly higher than Instagram's, and the slideshow format maps directly to your existing carousel content.
- 4
Automate production with AI tools
Use AttentionClaw to generate brand-consistent carousel slides from your copy. This cuts per-carousel production time from 20 minutes to 3-5 minutes, making it feasible to produce 7-10 carousels per week without increasing your time investment.
Chapter 8
Building a weekly acquisition report in 15 minutes
Consistent reporting turns data into decisions. Here is the exact report structure that takes 15 minutes to produce and tells you everything you need to know.
Every Sunday, spend 15 minutes pulling your numbers and filling in your weekly report. This single habit is the difference between app developers who improve month over month and those who plateau after the first few weeks.
The report has three sections: pipeline metrics (impressions, saves, profile visits, link clicks, estimated downloads), content performance (top 3 carousels by link clicks, bottom 3 carousels by engagement), and action items (one optimization to implement next week based on the data).
Over time, your weekly reports build into a dataset that reveals seasonal patterns, content type trends, and long-term growth trajectories. After 12 weeks of reports, you will understand your acquisition channel so well that you can predict next month's downloads based on your content plan.
- 1
Section 1: Pipeline metrics (5 minutes)
Pull impressions, saves, profile visits, and link clicks from Instagram Insights. Pull download data from App Store Connect. Enter all numbers into your spreadsheet and calculate week-over-week changes.
- 2
Section 2: Content performance (5 minutes)
Sort this week's carousels by link clicks (not likes). Note the top 3 and bottom 3. For the top 3, identify what they have in common — hook style, format, topic. For the bottom 3, note what to avoid.
- 3
Section 3: Action items (5 minutes)
Based on your data, write one specific optimization to implement next week. Examples: 'Test urgency CTAs on all carousels,' 'Increase top-of-funnel posts from 2 to 3,' or 'Rewrite bio to emphasize free download.' One action, not five.
Chapter 9
Advanced attribution: Moving beyond last-click tracking
Last-click attribution (crediting the final touchpoint before download) significantly undervalues your carousel content. Most users see 5-10 carousels before they ever visit your profile and click your link. The carousel that drove the link click gets all the credit, but the awareness carousels that introduced them to the problem and your brand did the heavy lifting.
A more accurate model is to track assisted conversions. Every carousel that a user engaged with before downloading — saved, shared, or swiped to completion — contributed to the conversion. While you cannot perfectly attribute fractions of a download to each touchpoint, you can build a qualitative understanding of which content types play which roles in the journey.
Practically, this means not cutting content that generates high saves but low link clicks. Those carousels are likely top-of-funnel assets that introduce users to your brand and set up the eventual conversion. Cut them and your bottom-of-funnel carousels may start underperforming too, because the audience they are converting was built by the awareness content.
Last-click attribution dramatically undervalues top-of-funnel awareness content
Track 'assisted conversions' by noting which content types users engaged with before converting
High-save, low-click carousels are likely doing essential awareness work — do not cut them
Use audience surveys in Stories to understand how users discovered your app
Build a mental model of the typical user journey: which carousel types do they see first, second, and last?
Chapter 10
When organic carousels outperform paid acquisition (and when they do not)
Organic carousel acquisition has clear advantages and clear limitations compared to paid channels. Understanding both prevents you from either over-investing or underestimating this channel.
Organic carousels outperform paid acquisition in three scenarios: when your budget is under $5,000 per month (organic's time cost is lower than the paid CPI at this scale), when your app needs trust-building content that ads cannot provide (complex or high-commitment apps), and when you are optimizing for retention rather than just installs (organic users tend to retain at significantly higher rates than paid users because they were pre-educated by your content).
Paid acquisition outperforms organic when you need rapid scale (1,000+ installs per day), when you have a proven conversion funnel and just need volume, or when your app's target market does not engage with educational content on social media. The ideal strategy for most apps is starting with organic to validate messaging, then layering paid on top to amplify what works.
Organic users tend to retain at higher rates than paid users due to content pre-education
Organic is more cost-effective at under $5,000 monthly marketing budgets
Paid is better for rapid scale and time-sensitive launches
The best strategy starts organic, validates messaging, then layers paid to amplify winners
Organic content continues working indefinitely — paid stops the moment budget runs out
Next step
Turn this guide into a production-ready carousel.
AttentionClaw generates brand-consistent Instagram carousels and TikTok slideshows in minutes. Spend less time on design and more time optimizing the metrics that drive downloads.
Keep the workflow inside AttentionClaw.
Common Questions
FAQ
More Reading
Keep reading
8-chapter read
App Referral Program Social Content: Posts That Explain Sharing
App referral program social content should explain why sharing helps both people, how the referral works, what the reward or benefit is, and what happens after the friend joins. Use screenshots, clear rules, trust language, and specific use cases instead of vague 'invite your friends' posts.
8-chapter read
Social Proof Posts for Apps With Few Reviews
Apps with few reviews can still create credible social proof by showing product proof, beta feedback, workflow evidence, founder responsiveness, changelog progress, and user questions answered. Do not fake testimonials or overstate traction. Make proof specific, modest, and connected to the user's decision.
7-chapter read
Instagram Carousel Ads for App Install Campaigns
Instagram carousel ads can drive better app install intent when each card explains one user job, shows the app doing real work, and hands off to a store or landing page that repeats the same promise.
7-chapter read
TikTok Carousel Ads for App Install Campaigns
TikTok carousel ads can support app install campaigns when the image sequence explains one app outcome, shows proof through screens or workflow, and sends the tap to a store or landing page that continues the same promise.
App Marketing on $0: How to Grow Downloads With Just Instagram Carousels
Funded startups can outspend you on ads, but they cannot out-content you. Instagram carousels are the most effective free marketing channel for bootstrapped app developers who need downloads without a budget.
ASO Meets Social Media: How App Store Optimization and Carousels Work Together
App store optimization and social media marketing are usually treated as separate disciplines. Combining them creates a flywheel where carousel traffic boosts your ASO rankings and better rankings amplify your social content's conversion rate.
How to Build an App Download Funnel Using Only Social Media Content
You do not need landing pages, email sequences, or ad budgets to drive app downloads. A well-structured social media content funnel can take someone from first impression to install in under a week.
TikTok Slideshow Strategy for App Marketing: The Organic Growth Playbook
TikTok slideshows are the fastest-growing content format on the platform, and app developers who use them strategically are driving thousands of installs from organic reach alone.
SaaS Instagram Strategy: Why Carousels Are Your Best Organic Growth Channel
Most SaaS companies treat Instagram as an afterthought. The ones winning organic growth have figured out that carousels consistently outperform every other format for reach, saves, and profile visits.
Carousel Analytics: The Metrics That Actually Matter (And How to Track Them)
Most creators obsess over likes and follower count while ignoring the carousel-specific metrics that actually predict growth. This guide breaks down the numbers worth tracking and the benchmarks that separate average from exceptional.
Written by
AttentionClaw
Editorial Team
Editorial context
Part of the Content Planning topic cluster. Last updated June 22, 2026.